In Sabermetrics, Wins Above Replacement (WAR) is a well-established concept. The underlying theory is simple: measure a player’s value according to the fraction of wins they contribute above what a replacement-level player could provide. Despite this unifying creed, there is no singular formula for its derivation. Throughout the years since its inception, countless versions of WAR have been proposed and published. Each offers a unique perspective on the fundamental problems that comprise Wins Above Replacement – For instance, how does one approximate runs contributed by a player? What defines replacement level? How many wins is a single run worth?
More recently, WAR has been adapted by quantitative analysts in various other sports including basketball and hockey. Notably, the now-defunct WAR On Ice website published their namesake in a series of posts in 2015. Other attempts have been made since, including Dawson Sprigings’ version from 2016. Over the last little while, I’ve developed by own brand of WAR using much of the framework from my K model as a launchpad. This post will cover as little of the underlying math as possible. Instead, I’ll aim to outline some of the features I seek in a valuable WAR metric and discuss my philosophy behind Wins Above Replacement.
Like baseball, there is no single process in hockey by which players exert an influence on the creation of wins. Just about any event on the ice surface during play can affect the rate of goals – from a faceoff win, to a body check, to a failed pass attempt. Where hockey differs from baseball is in the complexity of the system. The most structured contest between two hockey teams is a chaotic symphony of competing processes involving a dozen actors at once, whose identities are constantly in rotation. While baseball is not short on intricacies, it is fundamentally turn-based and more easily broken down into components. This simplifies the task of measuring a player’s impact. Assume that a position player has the following responsibilities:
- Batting
- Base running
- Fielding
You could then obtain that player’s WAR by finding how many runs they contributed relative to a replacement-level player in each category, then converting runs to wins. Both remaining steps have their own challenges and they are largely shared between sports.
My belief is that the tricky part in applying WAR to hockey lies not in these transformations, but rather the process of defining a player’s impact as the sum of unique components.
On the surface, identifying manners in which players can contribute positively or negatively is not difficult. The challenge lies in avoiding overlap between these categories, such that the sum of the contributions truly represents a player’s total value. Consider the notion that a hockey-WAR should include a faceoff component. That is, a player’s success at winning faceoffs, or lack thereof, should count as a sub-component of their Wins Above Replacement. Now, you want to include a second component: the player’s partial impact on shot suppression. You find that Patrice Bergeron, He of 60.1 FO% and -8.72 Rel CA/60, is worth 7 goals above replacement.
Do you see where you went wrong?
Without meaning to, you counted the effect of faceoffs twice. While one can isolate the value of a won or lost draw, part of this value is implicit in the ensuing rate of shots allowed. Every time Bergeron wins a faceoff, that value is dispersed throughout the shift. Hence, if you insisted on including faceoff-WAR in a proposed model, all remaining factors would have to be adjusted accordingly.
I believe the blueprint for a WAR model’s makeup merits meticulous consideration. A successful one should capture all major contributions a player might have, without allowing overlap. This, incidentally, was a topic of much significance in my K paper.
My proposal with K was that skaters could exert an influence on the occurrence of goals through their involvement in any of four processes:
- Shot rates
- Goal probability
- Penalty rates
- Zonal transitions
While there are numerous ways in which I believe my WAR metric is an improvement over the K model, the biggest difference is a shift towards shot quality. In K, goal probability was modelled as a binary response to a vast variable set including the presence of skaters on the shooting team and the defending team. The inclusion of these dummy variables was a choice I believed would allow the regression to capture shot quality effects that were not tangible in xG, such as screening and passing plays. In reality, this decision put K at risk of overfitting to false positives or negatives, despite my best efforts to avoid just that.
My framework for WAR allows for skaters to influence the approximate shot quality attributed by xG to unblocked shot attempts occurring for or against their teams while on the ice. The ability to convert shots at a rate better or worse than expected is measured separately and assigned entirely to the shooter.
The complete list of WAR components is:
- Offensive shot rates
- Defensive shot rates
- Offensive shot quality
- Defensive shot quality
- Shooting
- Penalties taken
- Penalties drawn
- Zonal transitions
With a ninth component unique to goaltenders, measuring the ability to prevent goals.
In the absence of preventative measures, these components are not completely distinct. For example, the likelihood of a goal for any given shot is influenced by both the measured quality of that shot and the talent of the shooter in question. In such cases, it is required to control for the effects already captured in the other component. In this particular example, this is achieved by including xG as a variable in the goal probability model. Thus, players each have a partial impact on the expected goal value of a given shot, and the shooter can further impact that shot’s goal likelihood beyond what is expected.
These control variables serve to avoid overlap between WAR components as well as adjust for factors beyond a player’s control, such as game states, home ice advantage and zone starts. Consider an equation describing a shot’s goal probability of the general form:
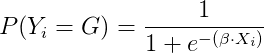
where X is the feature matrix and ß is a vector of coefficients. We can define a simplistic model of goal probability as a function of the linear combination of who the shooter is (say, σ) and who the goalie is (say, γ):
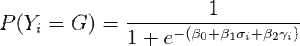
From which we can derive the odds ratio describing a shooter’s partial impact on the likelihood of scoring, independent from the goaltender’s impact.
We can expand this framework
to include a third variable, the xG value of the shot. The probability of a goal then becomes a function of the linear combination of shooter, goalie and xG and the odds ratio e^ß1 remains the partial impact of the shooter, this time controlling for both the goaltender and the estimated shot quality.
This is the core structure of the shooter-WAR regression. In addition to the three variables mentioned above, the full model controls for score effects, zone starts, home ice and skater advantage. Using dummy variables to represent the shooter, each player is given a coefficient after regularization, the exponent of which represents the multiplier on the baseline odds applied when a given player acts as shooter. For example, a player given a coefficient of 0.050 equates to an odds ratio of 1.051. Assuming a league average Fenwick shooting percentage of 6.4%, that would mean roughly 0.0034 goals added per unblocked shot attempt.
Each of the WAR components is modelled in this fashion. The type of regression used is case-dependent, as was the case with K. For shot rates, I opted for a proportional hazards approach. A standard linear model was used for the shot quality components, and I chose to use a Poisson regression for penalty rates, following in the footsteps of WAR On Ice founders A.C. Thomas and Sam Ventura. From here, the rest is just algebra.
Well, it’s worth talking about what exactly replacement level means.
To the best of my research, the classical definition of a replacement-level player in sabermetrics is one who can be signed at the league minimum salary. This distinction is not as arbitrary as it may seem at first glance. There is an intuitive quality I enjoy of metrics displayed as relative to average. However, in the sense of true value added, it is important to consider what real life recourse exists in the hypothetical scenario that a player vanish entirely. If not this player, then who? The replacement baseline exists to occupy the exact threshold of league competency. League minimum salary is strictly the lowest possible cost associated with replacing a player on your roster, whatever the hypothetical reason.
So, how exactly do I calculate WAR? I will try to answer that in short order. It involves lots of math and data and hours behind a computer. But, I believe the product is a strong estimate of the true value provided by NHL players.