
Increasingly, I’ve looked for ways to incorporate human input into my statistical modelling of hockey. For all its shortcomings, not the least of which is bias, scouting-based evaluation still captures things that have yet to be appropriately represented in publicly-available NHL data. The success stories told of those who excelled using analytics in hockey will be about people who effectively bridged the gap between two strangely dichotomous schools of thought.
With this in mind, I sought to learn more about the three stars selections that occur every game.1Henceforth, when I say “three stars” it should be understood I mean the game-by-game nominations, not the weekly or monthly awards. My intentions were twofold: I wanted to learn what factors influenced these decisions and how, but most importantly, I wondered if one could derive a Game Score using a model trained on the three stars history.
The problem with stars as a rating device is simple: there just isn’t enough granularity. Over 92% of players involved in a game receive the same exact rating. Additionally, there is no sense of the distance between each of the four possible classes in a given game. In plain terms, how much better than the second star was the first star? Who was the best player not to receive a star? Surely, one could glean more information by asking the panel, but we don’t have that luxury.
I extracted every three star selection since the 2007-2008 season and paired the data with player stats from each respective game. For the reasons listed above, it became clear that this wasn’t a classification problem. That is to say, my ultimate goal in fitting a model to this data was not to gain the ability to assign my own three stars in a separate set of games. After all, we expect that the availability of actual star selections will continue. Instead, I approached this as a forecasting problem. While we can’t coerce a discrete ordinal variable into a continuous value, we can produce a probabilistic response – the odds for every player of receiving each possible star class. These probabilities will serve as a launchpad for a continuous Game Score rating.
After some experimenting, I settled on using a neural network to model the three star probabilities. The neural network allowed for the inclusion of both goalies and skaters and the appropriate interactions with the remaining predictors. In total, 33 variables were used to predict 4 possible responses. The independent variables ranged from simple goals and assists, to various goaltending metrics, to reference points for the top performers in each game. The latter inclusion permitted the model to differentiate between say, a two-point performance in a game where the top point producer had two points and a two-point performance in a game where the top point producer had five points.

I used a 6-fold cross-validation policy to tune the model. The loss function to be minimized was the generalized Brier score:
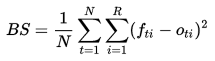
where the misclassification penalty is exponentiated and summed over all classes. A control score was produced in each fold, using the average probabilities for each class. This control error would serve as a baseline for the model.
The control Brier score in cross-validation was 0.149, while the model recorded a score of 0.097.2Lower is better. The neural network diagrammed below contains eight hidden neurons. The numbers of neurons was chosen to balance model performance with computational cost.

The complexity of neural networks makes it difficult to interpret the partial effects of its components. This is something I’ll revisit later. My current focus is on the validity and usefulness of the model.
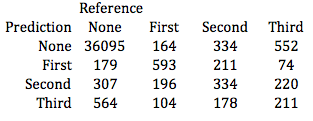
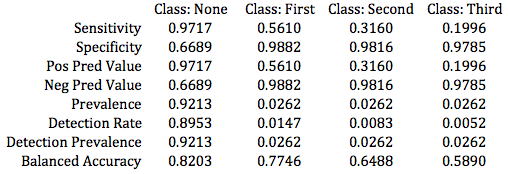
After cross-validation, a neural network was trained on games between 2007 and 2016, then used to forecast star selections in the 2016-2017 season. Even though classification accuracy was not the goal, I found it interesting to build a confusion matrix and compare the model results to a No Information Rate, or the accuracy yielded by simply predicting each observation would belong to the largest class (no star). While the model accuracy modestly surpassed the NIR, its P-Value was 0.0523. This indicates a non-trivial likelihood that the model offers no improvement over the NIR when it comes to simple classification. The model accuracy on 2016-2017 data was 92.35% with a 95% confidence interval of (92.09%, 92.61%), while the NIR was 92.13%.
Again, the model recorded a better Brier score than the baseline mark, at 0.098. Additionally, when ignoring the order of the three stars the model successfully predicted the entire slate in 24.9% of games out-of-sample. Further, it correctly called at least two of the three stars in nearly 80% of games, while failing to make a single correct star selection only 11 times out of 875 games.
The task of deriving Game Score ratings from these star probabilities poses a problem. That is, what is the correct way to weight the three star categories? Until we can convert these classes to a common currency, we can only say that a given player is worth x first stars, y second stars and z third stars. Evidently, this is less than optimal.
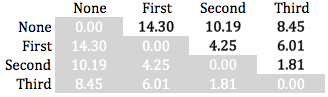
My approach to weighting the star classes is unconventional, but the end result closely resembles what my own arbitrary weights might have been. I first located the centroids for each class in the training data set feature space. In simpler terms, I found the central points of players belonging to each of the four classes in a 33-dimensional space whose dimensions are defined by the features used in the model. I then calculated the distances between each of the centroids, summarized in the matrix below. The distances between the second and third-star centroids and the no-star centroid relative to the first-to-no-star distance served as weights. So if we assign a weight of 1 to the distance between the first-star centroid and the no-star centroid, the relative distance between the second-star and no-star centroids would equate to a 0.71 weight.
Thus, we arrive at a formula for Game Score:

Summarized below are the top and bottom ten players in terms of total Game Score this season:

For comparison, four of the top-10 skaters listed above also appear in Dominik Luszczyszyn’s top-10 according to his own Game Score.3I should give due credit to Dom for being the first to derive a Game Score for the NHL. He’s as smart as his name is long, and I don’t intend to supplant his work with this alternate version of Game Score. Nine of the top ten skaters above appear in Dom’s top-20 and indeed the largest difference exists between our rankings of Alex Ovechkin who is 21st by Dominik’s Game Score.
All in all, I believe there is value in these ratings. Though, further validation is required to justify its use over alternatives – Dominik’s version, for instance. There’s also a good chance the model could be significantly improved upon given some more thought and a wider array of training data.
References
| 1. | ↑ | Henceforth, when I say “three stars” it should be understood I mean the game-by-game nominations, not the weekly or monthly awards. |
| 2. | ↑ | Lower is better. |
| 3. | ↑ | I should give due credit to Dom for being the first to derive a Game Score for the NHL. He’s as smart as his name is long, and I don’t intend to supplant his work with this alternate version of Game Score. |