Corsica offers two brands of adjusted stats. The first accounts for score state and home ice advantage, while the second additionally factors in zone starts. The method used for the former is Micah McCurdy‘s and the latter is my own adaptation thereof. In principle, McCurdy’s method looks to adjust the value of shots taken by either team involved in a game according to the score state and status of the shooting team. It’s been shown that his approach represents a significant improvement over its predecessors, namely Eric Tulsky’s Score-Adjusted Fenwick proposed in 2012. Fewer attempts have been made to develop zone start adjustment methods. David Johnson’s method of removing shots occurring within an arbitrary time span of face-offs is exceedingly crude and inefficient and hence is not discussed further.
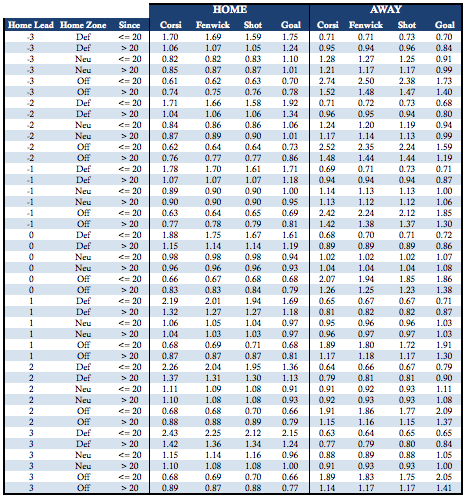
In McCurdy’s method, the historical number of events for either team is counted for each possible score state from the perspective of the home team. For instance, when trailing by one goal, home teams have recorded 51,921 unblocked 5v5 shots while their opponents (the away team) have recorded 43,075 between 2007 and 2014. The adjustment coefficients, or weights, are selected in order to satisfy this ratio while producing a total quantity of weighted shots that is equal to the original unadjusted total. The coefficients are given by: coef(team) = [average # of events]/[# of Events for team]. I calculated these coefficients for each of shots, unblocked shots, shots on goal and goals using the complete (at the time) data set since 2007, staying true to Micah’s original formula. These weights are used for “Score and Venue Adjusted” stats.
Coefficients are similarly calculated for the “Score, Zone and Venue Adjusted” measures. Here, a more diverse array of situations are considered. A face-off can occur in any of three zones – offensive, defensive or neutral. For each event of interest, we consider the zone in which the last face-off occurred in addition to the score state. As a final property, the recency of the last face-off is taken into account. This serves to avoid generalizing entire shifts by where they began. This implicitly solves the issue of on-the-fly deployment. That is, players on the ice for an offensive zone draw receive a much different (greater) advantage than those coming on 45 seconds thereafter. The face-off start parameter is divided into two subcategories: the first 20 seconds and the remainder of the sequence. This cut-off is chosen to reflect the fact that almost all of the advantage related to a zone start is contained within the first 20 seconds of play. The seven score states are then multiplied by six possible face-off start subcategories, giving a total of 84 coefficients for both teams:
The distribution of differences obtained with the Score, Zone and Venue Adjusted measures is much wider than simple score adjustment:
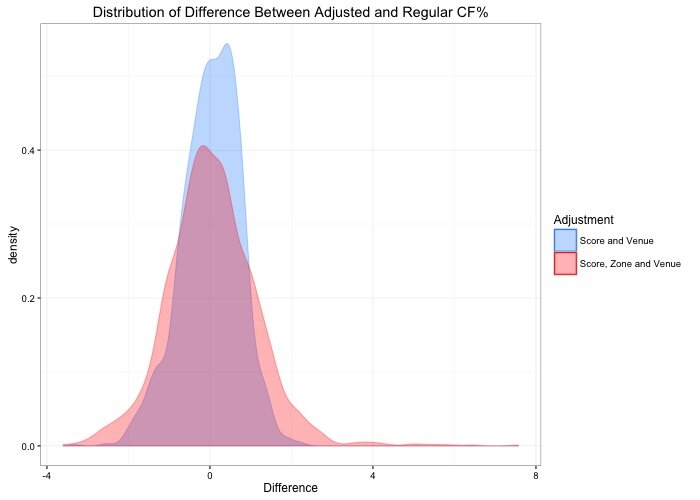
The largest single season increase in CF% by Score, Zone and Venue adjustment over the last three years is Paul Gastad’s 2015-16 campaign, worth 7.57 percentage points. This represents an increase from 38.38% to 45.95%. Gaustad was deployed in only 31 offensive zone face-offs to 418 in the defensive zone at 5v5.